Do you want to add a WordPress query monitor on your site? A query monitor gives you behind the scene look on your WordPress site. In this article, we will show you how to add a WordPress query monitor on your site and debug performance issues like a pro.
What is the WordPress Query Monitor?
WordPress query monitor is a debugging tool that monitors the requests your WordPress website makes to the server.
You can then use this information for troubleshooting WordPress issues or find and fix common WordPress errors.
Some of the things you can look up are:
- Database queries triggered by a page in WordPress.
- HTTP requests made by scripts in your themes or plugins
- Hooks and actions triggered on a page
- Language, user role checks, and template files used to display the page
- Your hosting environment like PHP and MySQL versions, memory limits, and more.
That being said, let’s take a look at how to add a query monitor on your WordPress site.
Adding Query Monitory in WordPress
The first thing you need to do is install and activate the Query Monitor plugin.
Upon activation, the plugin will add the query monitor menu to your WordPress admin bar.
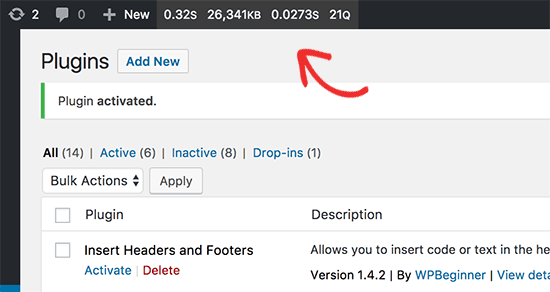
Taking your mouse over to the query monitor will display the menu allowing you to jump to a parameter quickly. You can also click on the query monitor stats to view all data.
Viewing Data in WordPress Query Monitor
First, you need to make sure that the WordPress admin bar is visible when you are viewing your website. Simply go to Users » Your Profile page and check the box next to ‘Show Toolbar when viewing site’ option.
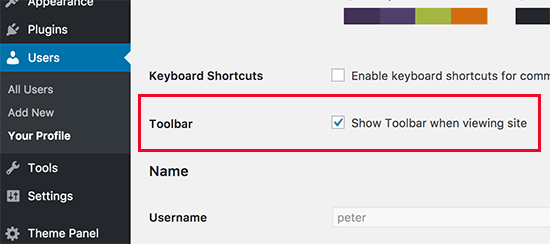
Don’t forget to click on the ‘Update profile’ button to store your settings.
Next, you need to visit the page you want to check the queries for. Once on this page, simply take the mouse over to the query monitor menu in the admin bar and click on the section you want to view.
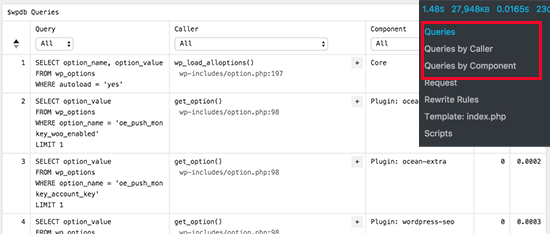
Monitoring SQL Queries
The query monitor plugin allows you to monitor all SQL queries, queries by the caller, and component. Queries by component section show you query by plugins, theme, and core files.
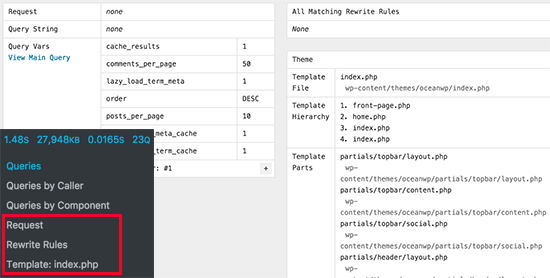
Rewrite Rules and Templates
This section shows you matching rewrite rules and the templates used to display the current page.
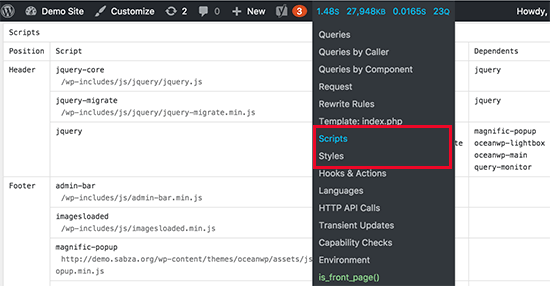
Scripts and Styles
Scripts and Styles section shows you Javascript and stylesheets loaded by your theme and plugins. You will also see where these files are loaded (e.g. header or footer).
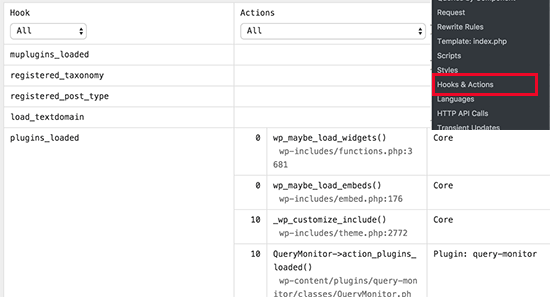
Hooks and Actions
This section shows you the hooks used and the actions triggered while loading the current page.
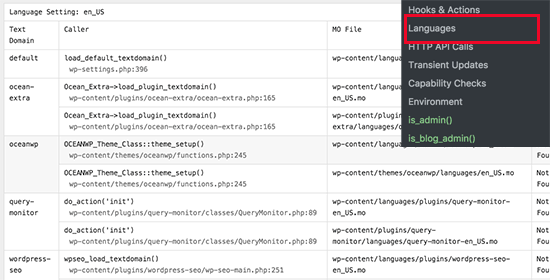
Languages Section
This section shows you the language files requested and loaded by the current page. If you run a multilingual WordPress site, then this helps you figure out which theme and plugins have language files available.
HTTP API Calls
This section displays HTTP API calls made to third-party API libraries.

Transient Updates
Transient API allows developers to store information in your WordPress database with an expiration time. This section displays any transient updates requested during the current page load.
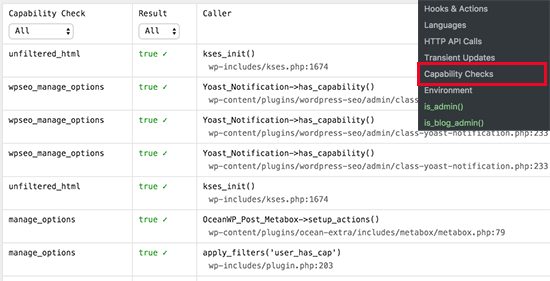
Capability Checks Section
This section displays user role capabilities check run by the WordPress core, plugins, and themes while loading the current page.
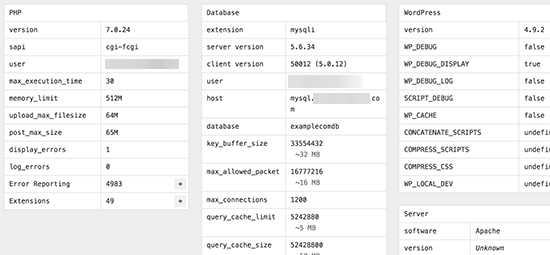
Environment Section
This is where you will get your WordPress hostings environment information like PHP version, MySQL version, MySQL Host, WordPress database name, and more.
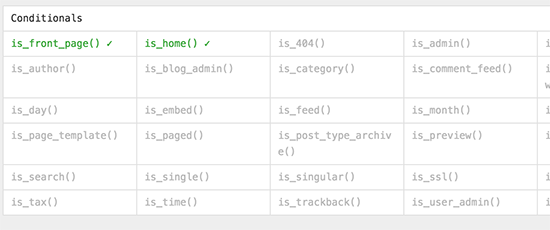
Conditional Checks
This is where plugin shows conditions that were required to display the current page view.
We hope this article helped you add a query monitor to your WordPress site and troubleshoot performance and security issues.
