Do you want to add bars and charts in WordPress? Visual aids like the graph, bars, pie chart, and others are a perfect way to add data beautifully with your content. In this article, we will show you how to create bars and charts in WordPress with Visualizer WordPress Charts and Graphs plugin.
The Problem with Bars and Charts in WordPress
There are many WordPress plugins to add bars, charts, and graphs with your content. However, the most common complaint we have heard from our users is that these plugins are usually too complicated to use.
Some of these plugins even expect users to add data inside a shortcode in extremely complicated formats.
Instead of using those plugins, many users end up creating a chart in their office applications and converting them into an image.
This could work if you are planning to never change it. However, an image is no substitute for an interactive chart where helpful data appears when the user takes their mouse over a particular section.
An ideal chart and graph solution would allow you to:
- Add data from a data source on your computer or on the web.
- Populate charts, pies, graphs, and bars using your data.
- Create beautiful, interactive, colorful, and mobile friendly charts.
- Most importantly, it should let you update the data whenever you want.
Having said that, let’s see how Visualizer WordPress Charts and Graphs plugin helps you do all that.
Creating Bars and Charts in WordPress with Visualizer
The first thing you need to do is install and activate the Visualizer WordPress Charts and Graphs plugin.
While the free version does almost everything that you need, they also have Visualizer Charts and Graphs Pro which adds additional features to the plugin such as adding data directly using a spreadsheet-like interface and importing data from other charts.
It costs $79 for a single site license with one year of professional support and updates.
Note: This tutorial is about the free version of the plugin.
Upon activation, you need to visit Media » Visualizer Library page. This is where all your charts and graphs will appear.
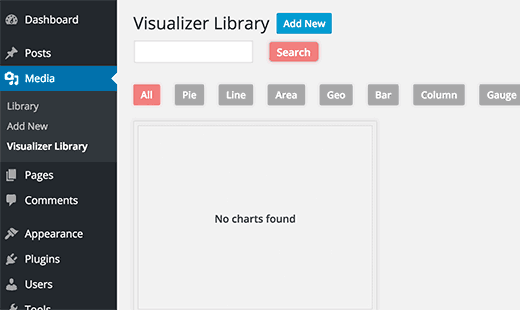
You need to click on the Add New button to add your first chart.
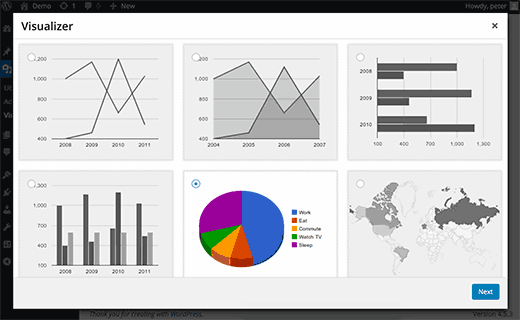
This will bring up a popup window on the screen. You will see different chart types available with the plugin. Simply select the chart type you want to add and click the next button to continue.
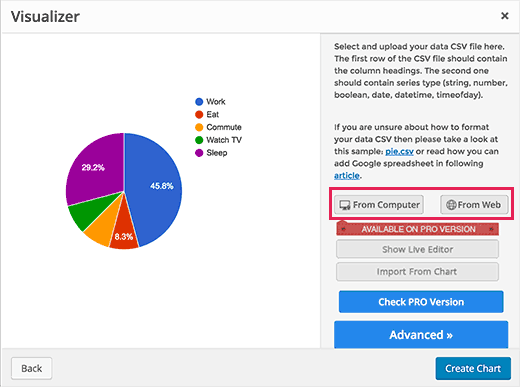
The next step is to add your data source in a CSV format. If you have saved your data as a spreadsheet using Excel, Google Sheets, or any other program, then you can simply export it as CSV file.
You can download or save your CSV file to your computer and then upload it by clicking on the ‘From computer’ button.
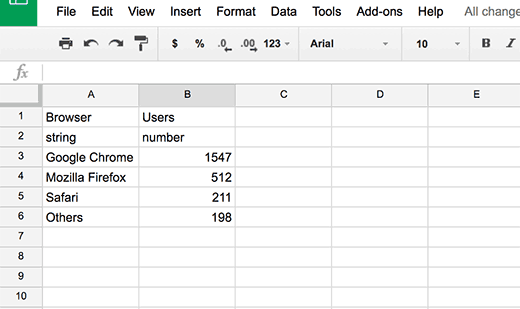
Your CSV file must have column names in the first row and data type in the second row. The plugin supports these data types: string, number, boolean, date, time date, and time of day.
Take a look at this example file we have created in Google Sheets.
If you are creating a CSV file using a text editor, then take a look at this example CSV file:
Browser,visitors

string,numbers

Chrome,7894

Firefox,6754

Internet Explorer,4230

Safari,2106

Opera,627
Adding a Chart in WordPress Using Google Drive Spreadsheet
If you have your chart data saved as a spreadsheet on Google drive, then you can add it to your chart without exporting it.
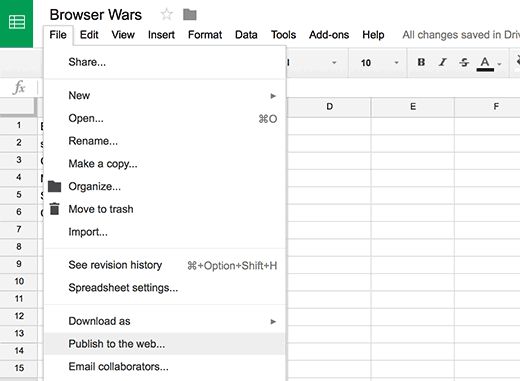
Open your data file in Google Spreadsheets and then click on File » Publish to the web.
This will bring up a popup where you need to select how you want to publish this document. You need to select Comma Separated Values (.csv) from the drop-down menu.
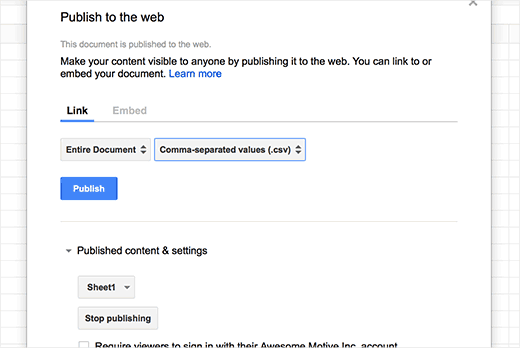
Don’t forget to click on ‘Publish’ button.
You will now see the publicly available URL of your sheet as a CSV file. You need to copy this URL and go back to the Visualizer chart.
Click on From Web button and then enter the URL of your Google spreadsheet’s CSV file.
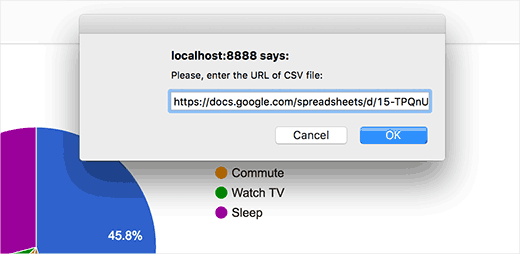
As soon as you enter the URL, the plugin will fetch your CSV file and will show a live preview of your chart.
You can now click on the create chart button to save your chart.
Adding a Chart or Graph in WordPress Posts/Pages
Adding a chart or graph to your WordPress posts and pages are as simple as adding images.
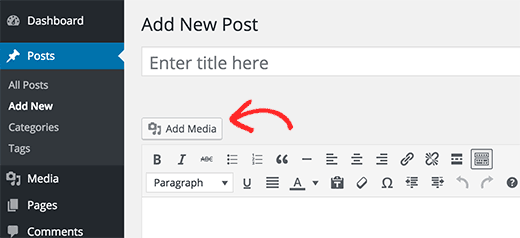
Create a new post/page or edit an existing one where you want to add the chart. On the edit screen, click on the Add Media button above the post editor.
This will bring up the WordPress media upload popup. You need to click on the visualizations tab from the left column. It will load all the charts you have created and saved on this site.
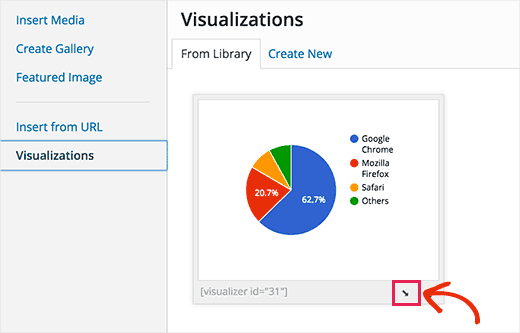
Click on the insert icon below your chart. The popup will disappear and you will see your chart added to your WordPress post as a shortcode.
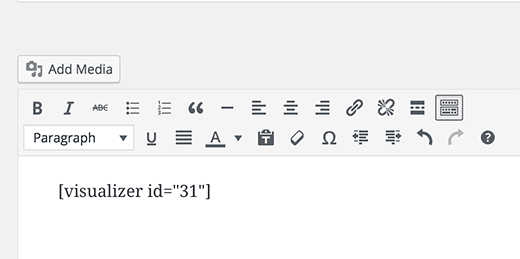
You can now save your WordPress post or page and visit your website to see the chart embedded into your WordPress post.
Editing Your Visualizer Charts in WordPress
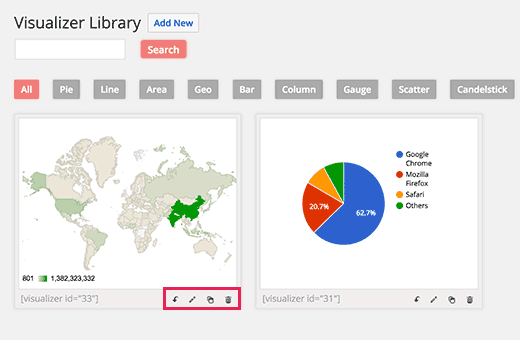
You can edit and change your charts anytime. Simply visit Media » Visualizer Library page. From there you can clone a chart, delete it, or edit its visual settings.
Updating data for an existing chart without changing the chart is quite easy with Visualizer.
If you added data from a Google spreadsheet, then all you need to do is update data in your spreadsheet and go to File » Publish to the web and republish your spreadsheet. Your changes will automatically reflect in your chart.
On the other hand, if you uploaded a CSV file, then you need to update the CSV file on your computer. Once done, select the chart that you want to update and click on the edit link below the chart.
In the Upload, CSV file section simply uploads your new CSV file. Changes in the data will automatically reflect in posts or pages where you have inserted that chart.
Adding a Chart in a WordPress Sidebar Widget
Visualizer uses shortcodes to insert charts. Simply go to Media » Visualizer Library, there you will see a shortcode below your charts.
Copy the shortcode and go to Appearance » Widgets. Drag and drop a text widget to your sidebar and paste the shortcode inside the widget.
We hope that this article helped you add bars and charts in your WordPress site.
